As a Geologist, you may be asked to produce a contoured gram meter plot to outline areas of the ore body that have the greatest value or potential ore shoots. This plot can also highlight areas of wider stopes, that then require more ground support during mining. This plot can also highlight areas where more drilling is required to upgrade the resource/reserve.
This is the 3rd post in the series “plotting long sections”. The files created in the 1st article, from the functions “Database>Composite>by Geological Constraints” and “Database>extract>zone thickness and depth” are required for this process.
Merging of Thickness and Grade Data
STEP 1
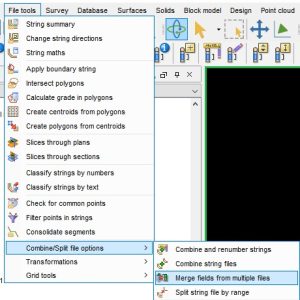
If we are to calculate gram meters, then we need to merge the true thickness field into a file with the grade field. To do this:
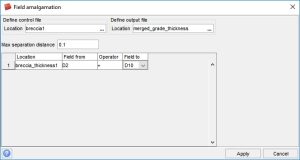
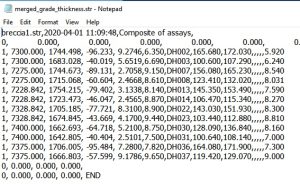
File tools>Combine/Split file options>Merge fields from multiple files
We are going to copy the thickness field which is in D2 to d10 in the merged file.
You can right click on the file in the navigator window and click on edit. This will open up the file in note pad. You can then see the result of the function.
STEP 2
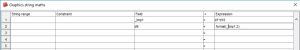
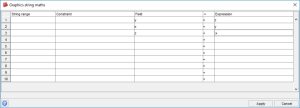
Open up the resultant file. Using Graphics Layer Maths, multiply d1*d10.
We are writing the result to a temp field first, so we can then round the result to 2 decimal places.
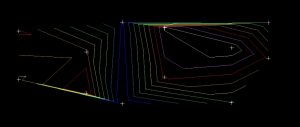
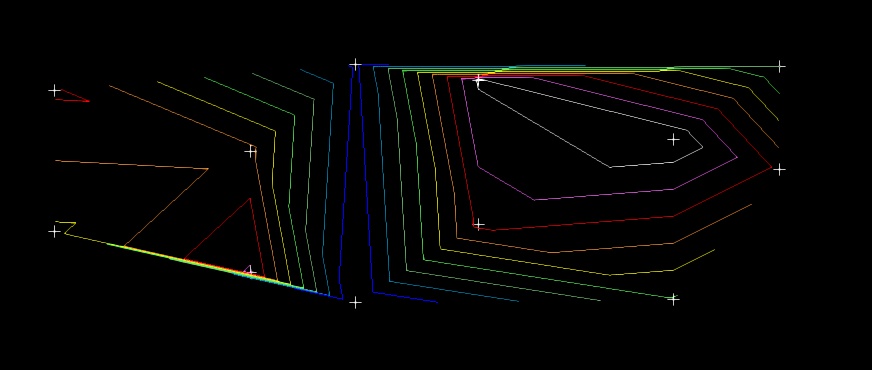
If you are wanting to contour the data, then depending on the orientation of the ore body, the data will need to be transposed to plan co-ordinates to contour, then transposed back to real co-ordinates.
Data to contour is in a y-z Orientation.
STEP 3
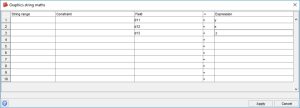
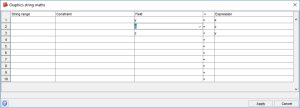
Using Edit>layer>maths
copy the y,x,z into d11,12,13 so you have a reference during the transformations.
Save the file.
STEP 4
Using Edit>layer>maths you can now transform the data.
STEP 5
Save the data as “transposed”
STEP 6
Create DTM and follow steps in the following blog to contour
Contouring soil assay results using DTM method in Surpac – Dassault Systèmes blog
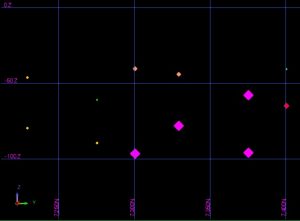
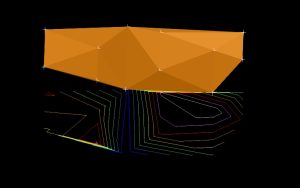
STEP 7
You will notice that the contours are a distance away from the dtm. This is because the Z value is the contour interval.
Using Edit>layer>maths, copy the z value into an available dfield, save the file and refresh the graphics.
STEP 8
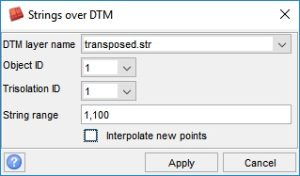
Open up the dtm, open up the contours, Surfaces>Drape string range over dtm and save.
STEP 9
Once the data has been contoured it will need to be transposed back to real world co-ordinates. To check the maths, transform the dtm first. Then transform the contour file.
STEP 10
You can then follow the steps in the previous posts below to plot the contours with the puncture points.