Proper representation of a surveyed area within a sheet that contains all the necessary information remains of paramount importance for Surveyors. Hence the act of taking the plot of actual data is a significant requirement.
Occasionally, surveyors may need to take the plot of a grid point RL value, of a surveyed area, with X-Y grid lines over grid points to check the profile undulation against RL variation.
Surpac has the capability to take such a plot, containing all the required information, into the sheet through a File-based plotting method.
In this example, I illustrate how to take a plot with the grid line offset using the Surpac file-based plotting method. To achieve this, you first need to create an entity related to which information you would like to display within the plot file.
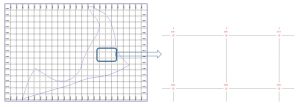
In the image below, I have two string files with grid points and a separate boundary line separately. I would like to plot the grid points with symbol & RL value with the boundary line.
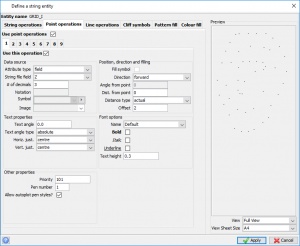
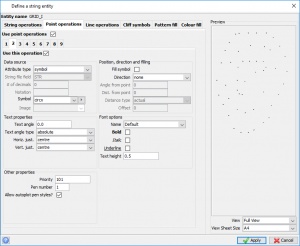
To display the RL value & symbol against each of the grid points, create an entity using Plotting > Entity > New and go to point properties as per the respective images below:
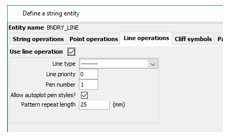
Create another entity displaying the boundary line as shown in the next image:
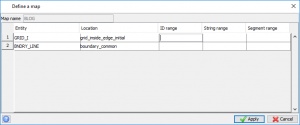
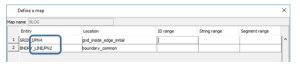
After obtaining the entity, go to Plotting > Map > New; browse respective string files against each entity:
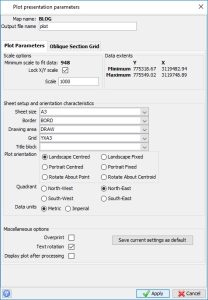
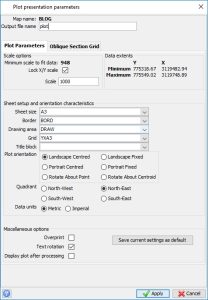
Then go to Plotting > Process > Map, and select the Map from the drop-down list.
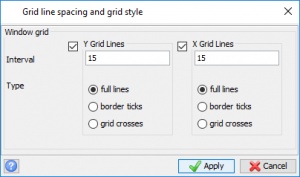
Choose sheet size, scale, grid properties (in this example grid spacing is 15×15), etc. as per your own requirements.
It will generate a DWF file and open the DWF file into Surpac Plotting window:
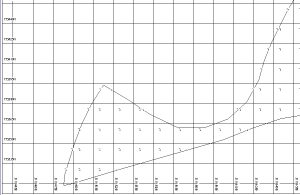
As you can see, the grid lines don’t currently reside over the grid points, but as i want actual grid lines over my grid point; I need to apply some grid offset for X & Y grid lines.
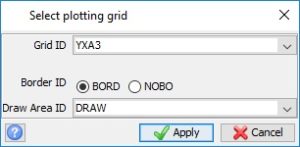
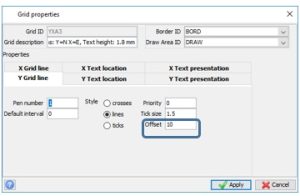
Go to Plotting > Plotting sheet setup window; a new plotting window will appear. Go to Grids > Select and chose Grid ID, Border ID & Draw Area ID, you have selected earlier:
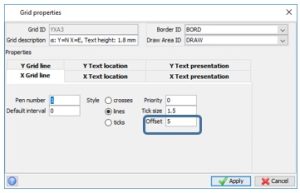
As per the initial plot file, it seems that we need to shift the X & Y grid line by offset amount 5 & 10 respectively. Go to Grids > Properties as per the image below, and then go to Grids > Save:
If you would like to change the colour of the grid points & boundary line, go to Plotting > Map > Edit:
Now to re-plot, again go to Plotting > Process > Map:
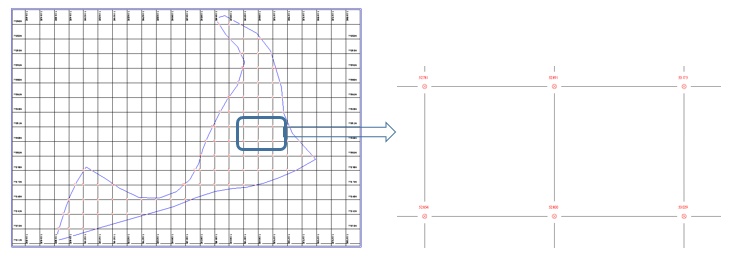
You will get another DWF plot file and open the DWF file into Surpac Plotting window. You will get X & Y grid lines now residing over grid points.